Financial reports
Reports from previous years not included below are available from Financial Services. Contact Sally Smart at ssmart@mta.ca or (506) 364-2443.
Annual Financial Reports
Prior to 2019, the information in the Annual Financial Report was compiled in two separate documents:
Annual Financial Statements
Review of Operations
Budget
Endowment Fund holdings
- Dec. 31, 2023
- Dec. 31, 2022
- Dec. 31, 2021
- Dec. 31, 2020
- Dec. 31, 2019
- Dec. 31, 2018
- Dec. 31, 2017
- Dec. 31, 2016
Note on the annual investment holdings report
Mount Allison University invests its endowment fund in a variety of asset classes (types of investments). It invests in pooled investment vehicles which provide the University with a more cost effective way to achieve diversification.
This means that the University does not invest directly in individual company stocks (equities) or bonds (fixed income), rather it uses investment managers to invest in pooled funds which in turn invest the University's funds, along with many other investors' funds, in individual stocks and bonds or other pooled funds.
Mount Allison selects and continuously monitors third-party investment managers with the assistance of an external investment consultant.
The annual investment holdings report discloses the underlying equity and fixed income holdings in its endowment fund. The market values reported in the report represent the value of the proportion of the stock or bond as if it was owned directly by the University.
Please direct any questions concerning these reports to the University's director of finance-controller, Guylaine Roy, at groy@mta.ca.
Compensation and expense reports
Federal Research Support Fund
Statements of account
Learn more about the Research Support Fund and how it facilitates research at Mount Allison.
Financial statements FAQ
These FAQs are provided to answer questions that are regularly asked about the University’s financial statements.
If your questions are not answered here, please contact Guylaine Roy, the University’s controller, at groy@mta.ca.
Financial statements FAQ
How is someone reading the financial statements able to gauge the overall financial health of the University?
To best gauge the financial health of the University and, indeed any not-for-profit organization, the financial statements should be analyzed in their entirety, along with supporting documents. At Mount Allison you can refer to the Annual Financial Report.
In addition, it is useful to pose questions to those tasked with the financial stewardship of the University such as Robert Inglis, vice-president, finance and administration (ringlis@mta.ca) and Guylaine Roy, controller (groy@mta.ca).
Reference is often made to different "funds". Why do the financial statements have different funds and what are they?
Under Canadian accounting rules, not-for-profit organizations, like the University, are required to show the observance of restrictions on different funds. Contributions that have limitations put on them by external parities are classified as externally restricted funds.
Even though the annual financial statements consolidate all these funds, the University still must maintain them and it shows the details for each fund in the schedules attached to the financial statements.
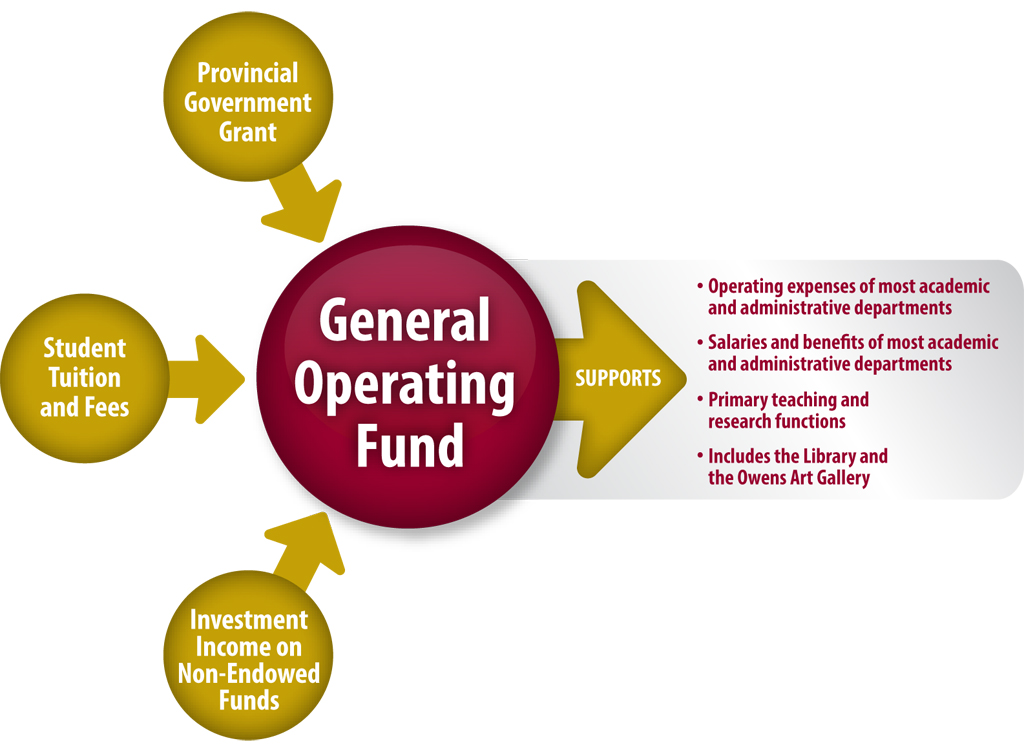
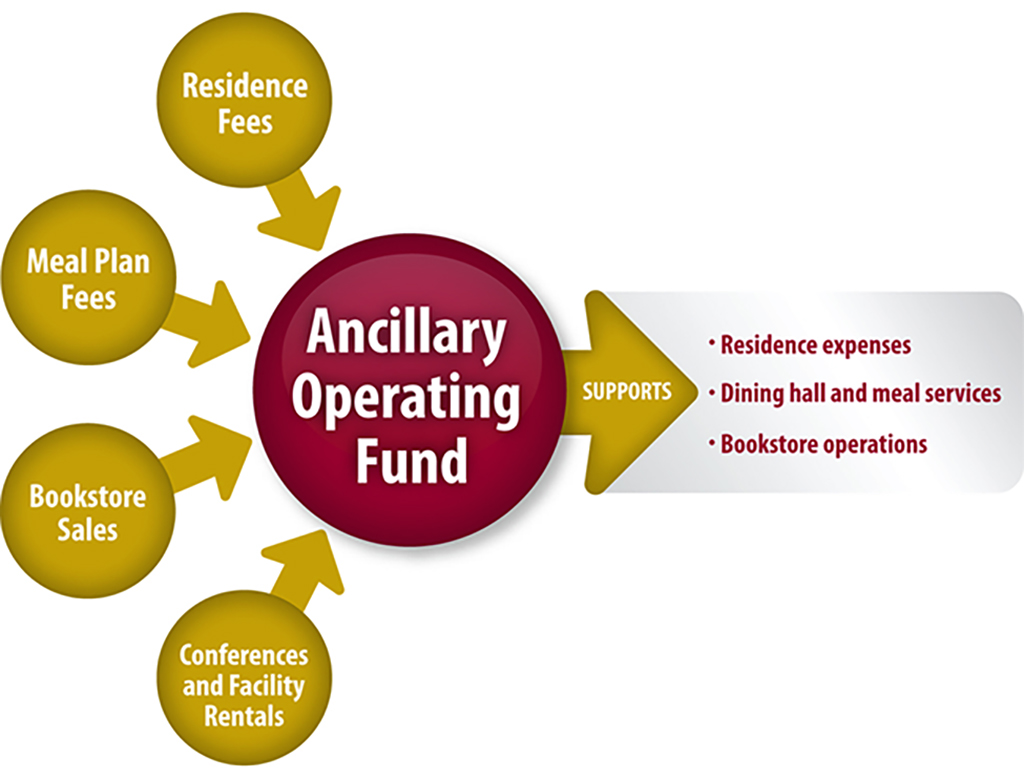
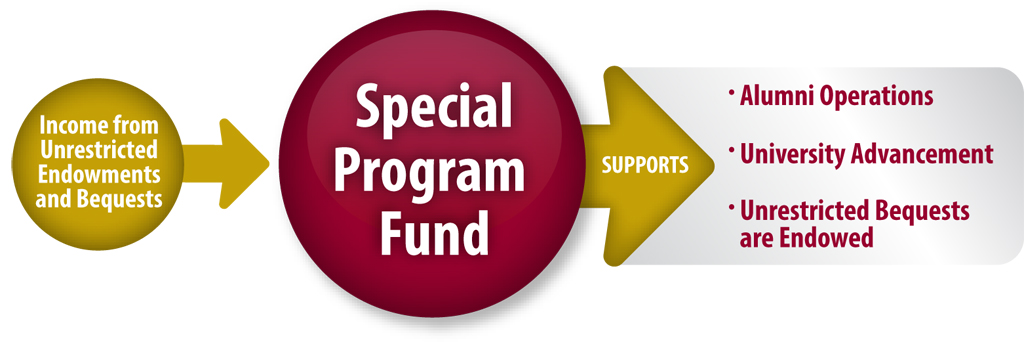
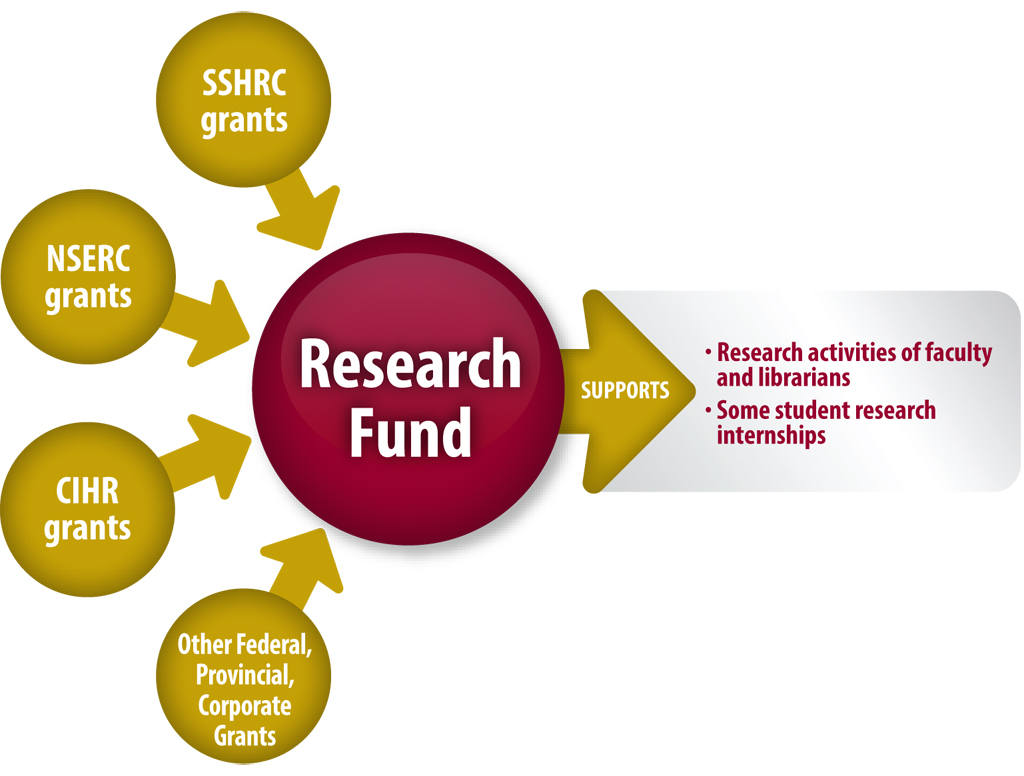
The University’s financial statements have eight funds:
- General Operating Fund
- Special Program Operating Fund
- Ancillary Operating Fund
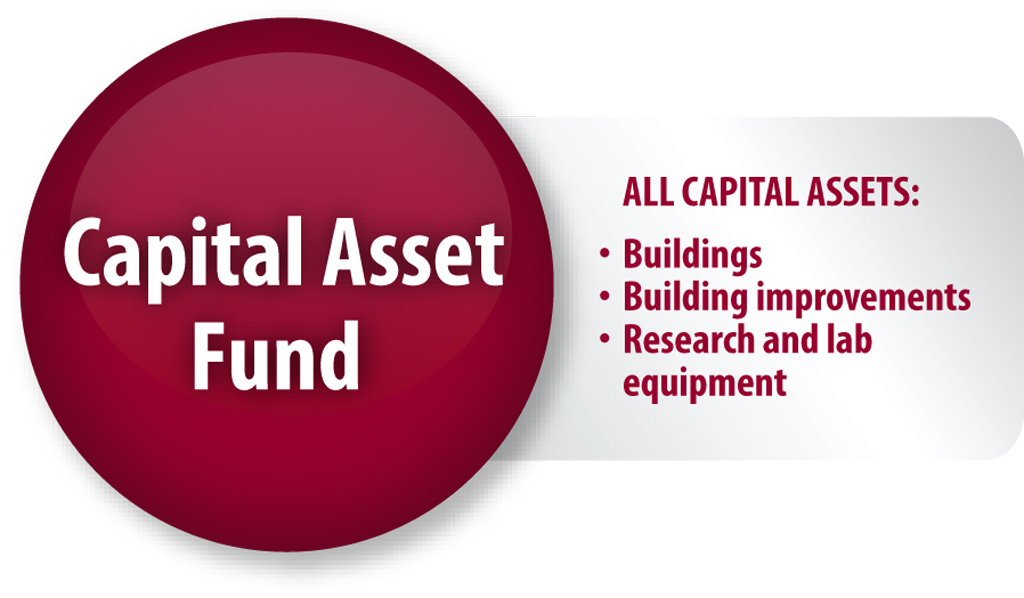
- Capital Asset Fund
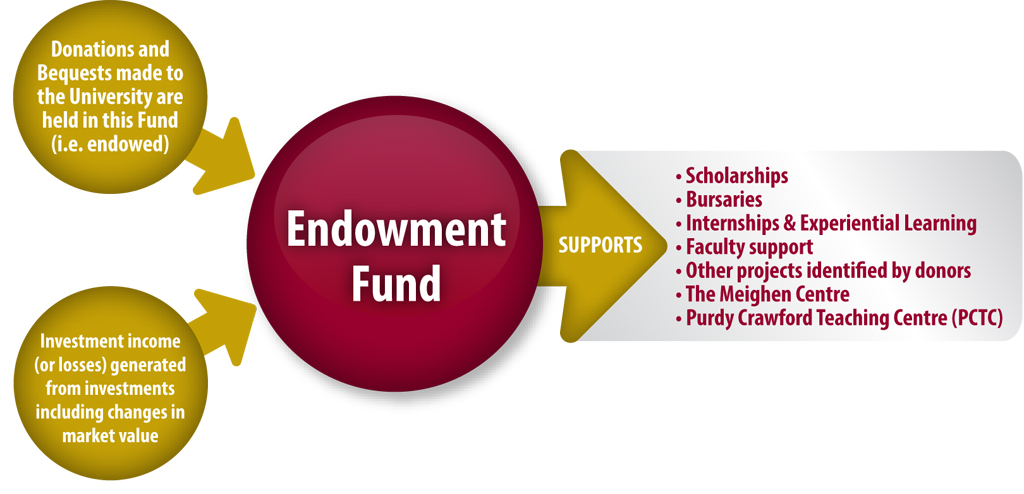
- Endowment Principal Fund
- Endowment Expendable Fund
- Research Fund
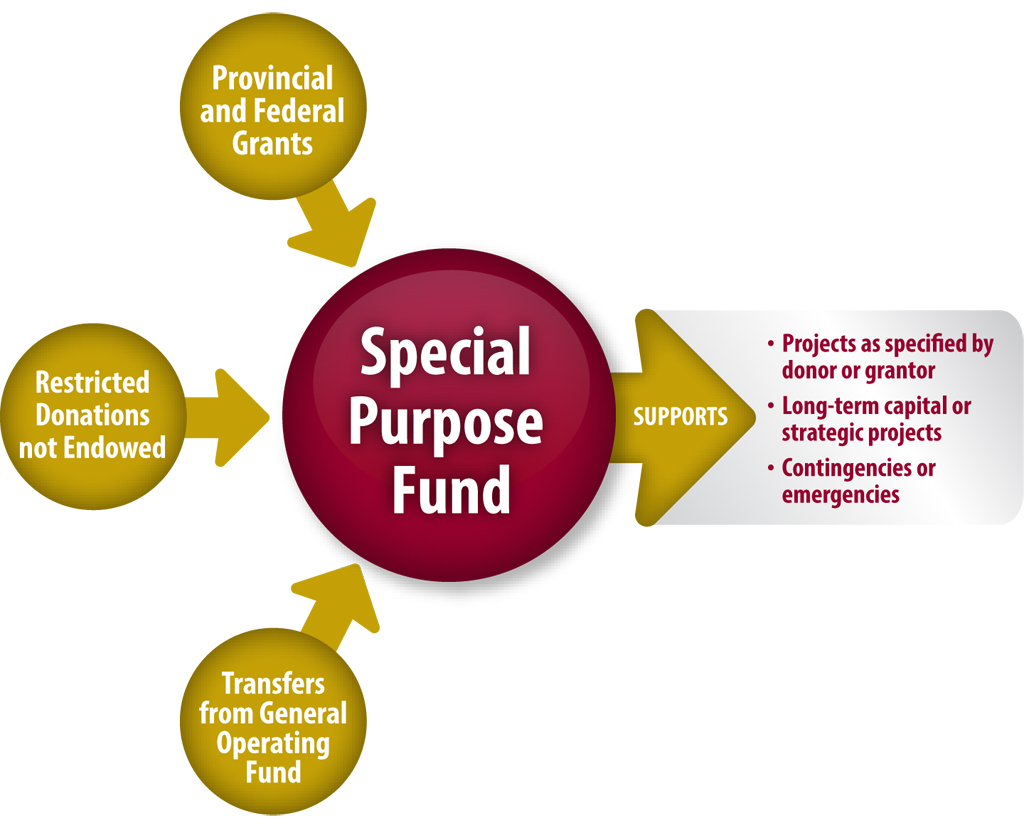
- Special Purpose Fund
Externally restricted funds can only be used for the purpose for which they were given to the University. An explanation of each fund is available in the understanding financial resources section below.
The audited Statement of Operations often shows “revenues over expenses” (or “expenses over revenues”). How does this arise and does it mean there is a surplus or deficit?
Revenues over expenses or expenses over revenue generally arises for two reasons:
1. How capital projects are accounted for
Money spent on small capital projects (minor repairs and upgrades) count as expenses and is reflected in the statement of operations. However, large capital projects (new buildings, major upgrades or repairs) must be accounted for as “assets” and expensed over the lifetime of the building or renovation.
For example, if $1 million from operating funds was spent on new windows for a building and those new windows were expected to last for 40 years, then 1/40th of the cost, or $25,000, would be counted as expenses each year. Although the $1 million was actually spent in the year the work was completed, the financial statements would show $975,000 of revenue over expenses in that year. The $975,000 would be shown as being invested in capital assets at the bottom of the statement of operations.
The Budget document, on the other hand, does show the cost of all capital projects as expenses in the year the revenue was actually used. A reconciliation from the audited financial statements to the budgeted results is in the Annual Financial Report.
2. The Endowment Fund earned more or less than was spent.
The Endowment Fund, like endowment funds at other universities, is designed to adjust for inflation. Actuaries have determined that if we spend 5 per cent each year, current and future members of our community will benefit equally from the Endowment Fund.
In years when the endowment earns more than 5 per cent, the excess is re-invested in the endowment principal and in years when less than 5 per cent is earned, that extra is drawn down from the endowment principal.
Even though amounts earned over 5 per cent are re-invested, they are still accounted for as revenue in our financial statements for endowments that are unrestricted. This can make the balance of revenue over expenses or expenses over revenue change significantly from year to year:
Investment income
- 2019 - $10,609,003
- 2018 - $7,351,655
- 2017 - $13,511,848
- 2016 - $3,197,841
- 2015 - $11,277,686
The change in investment income and the types of capital projects completed are two of the main reasons the amount of revenue and expenses can fluctuate significantly from year to year:
| 2019 | 2018 | 2017 | 2016 | 2015 | |
| Revenues | $76,112,161 | $73,283,395 | $78,809,333 | $68,021,741 | $74,583,808 |
| Expenses | $72,428,856 | $70,850,388 | $69,848,960 | $68,718,358 | $66,448,717 |
| Revenues over expenses or (Expenses over revenues) | $3,683,305 | $2,433,007 | $8,960,373 | $(696,617) | $8,135,091 |
Is there a surplus (or are there excess funds) in the General Operating Fund?
The General Operating Fund pays for all the academic, administrative, and other operating activities supported by tuition fees, government operating grants, and other revenue (see page 45 of the 2019 audited financial statements included in the Annual Financial Report).
An excess of revenue over expenses in this fund is not a surplus. Revenue in the General Operating Fund also supports activities recorded in other funds. For example, if the General Operating Fund provides a research grant to a faculty member, the amount is transferred to the Research Fund so the faculty member can spend it in support of his or her research.
After all items, including transfers in and out of the General Operating Fund, were recorded in 2015, 2016, 2017, 2018 and 2019 there was a shortage of funds in 2015, 2018 and 2019 and leftover funds in 2016 and 2017.
- 2015 - shortage of $712,404 (covered by the Contingency Fund)*
- 2016 - leftover amount of $374,560 (will be used to support teaching and research space in the Centre for Environmental Innovation project)
- 2017 - leftover amount of $49,772 (will be used to fund future capital equipment purchases)
- 2018 - shortage of $835,424 (covered by the Contingency Fund)*
- 2019 - shortage of $378,198 (partially covered by the Contingency Fund)*
*The Contingency Fund is within the Special Purpose Fund and is supported by the annual spending allocations on unrestricted endowments and unrestricted trusts and unrestricted donations and is used in times of revenue shortfalls or emergency expenditures. See Policy 7202 and the Budget document for more details.
What are the various schedules in the financial statements?
The financial statements are comprised of four main statements or schedules:
- the Consolidated Statement of Financial Position or balance sheet
- the Consolidated Statement of Operations or income statement
- the Consolidated Statement of Changes in Net Assets
- the Consolidated Statement of Cash Flows
The Consolidated Statement of Financial Position is a snapshot of the University’s financial position on the last day of the fiscal year.
The Consolidated Statement of Operations presents the University’s consolidated revenue and expenses over a one year period and, along with the Consolidated Statement of Changes in Net Assets, provides the financial statement user with information about the University’s net assets.
The University’s net assets are in five main categories, those that are:
- invested in capital assets
- endowed
- restricted for future pension benefits
- internally restricted
- unrestricted
The Consolidated Statement of Cash Flows provides information about how the University’s cash balances changed due to operating, financing, or investing activities.
These statements consolidate all the funds of the University. The three schedules after the notes to the financial statements provide details for each fund.
What are employee future benefit assets and employee future benefit obligations?
These represent amounts determined by our actuary relating to pension and other future commitments to University employees.
What are deferred contributions?
Deferred contributions represent amounts donated or contributed to the University for a specific purpose. Donations or grants received and spent for building projects are called deferred contributions for capital assets and will be recorded as revenues and expenses over time as the building is amortized or depreciated. Donations and grants received for other purposes are called deferred contributions related to restricted and endowed funds. They represent amounts not yet spent and will be recorded as revenues and expenses as they are spent.
Understanding Mount Allison's financial resources
The University receives funding from various sources for various purposes. Much of it comes from external sources with restrictions attached as to its use.
To manage these funds accurately, the University uses “fund accounting” which is a type of accounting system that emphasizes accountability rather than profitability and is used by universities, not-for-profit organizations, and government. Each fund is a self-balancing set of accounts that keeps track of funds and monitors funds coming in and going out by their intended purpose.
The University reports its financial activity in accordance with the Canadian accounting standards for not-for-profit organizations as prescribed in Part III of the Chartered Professional Accountants (CPA) Canada Handbook and in accordance with Part II of the CPA Canada Handbook for items not addressed in Part III.
Below you will find illustrations of the University’s various funds, showing the major sources of revenue for each fund and what the fund generally supports.
Responsible investing
Mount Allison University is committed to adhering to the principles of responsible investment in its investment policies and practices.
Responsible investment is an approach to investing that aims to incorporate environmental, social, and governance (ESG) factors into investment decisions, to better manage risk and generate sustainable, long-term returns.
Integration of environmental, social, and governance factors
Integration of environmental, social, and governance (ESG) factors into investment policies is considered best practice in relation to responsible investment.
The University's Board of Regents moved ahead with updating its investment policies and practices to incorporate ESG factors in 2017. ESG issues are considered in the selection of investment managers and other service providers.
Examples of ESG factors include:
- Environmental — climate change, greenhouse gas (GHG) emissions, resource depletion, waste and pollution, deforestation
- Social — working conditions, including slavery and child labour; local communities, including Indigenous communities; conflict; health and safety; employee relations; diversity
- Governance — executive pay, bribery and corruption, political lobbying and donations, board diversity and structure, tax strategy
Disclosure of annual holdings
Mount Allison provides a publicly-available list of the underlying stock and bond holdings in the University's pooled funds.
The endowment fund holdings are posted above in the Financial reports section.
Specific fund option for donors
An investment option for those donors who may be interested in putting new donations into a fund that excludes or limits certain sectors was added in December 2017.
For more information on the ESG Target Fund, contact donate@mta.ca.
Report on responsible investment
United Nations Principles for Responsible Investment (UNPRI)
The UNPRI provides a framework for reporting on and developing responsible investment activities. While the UNPRI is focused primarily on investment managers and investors, investment owners, such as the University, can become signatories. A limited number of Canadian universities are already signatories.
The University became an asset owner signatory in May 2018 and filed its first annual report in April 2019.
University Network for Investor Engagement (UNIE)
Mount Allison was one of 10 universities across Canada to be part of the initial February 2021 launch of the national University Network for Investor Engagement (UNIE) through the Shareholder Association for Research & Education. The non-profit organization works to engage with investee companies around environmental, social justice, and governance issues.
The network, a coalition of Canadian university endowments and pension plans, is a new initiative to engage with North American public companies in the areas of environmental, social, and corporate governance (ESG), including carbon footprint and climate risk.
UNIE's engagements focus on accelerating the transition to a low-carbon economy in key sectors where advocacy can make the biggest difference, including energy, utilities, finance, transportation and manufacturing.
UNIE Climate Engagement Reports
Advisory group reports
President's Task Force on Diversity and Inclusion
The President’s Task Force on Diversity and Inclusion was tasked with reviewing and providing recommendations for actions to help the University become a more diverse and inclusive community.
» Final Report of the President's Task Force on Diversity and Inclusion (pdf)
Independent Review of Mount Allison University’s Practices and Policies Related to Sexualized Violence
The Canadian Centre for Legal Innovation in Sexual Assault Response (CCLISAR) was engaged by the University to form an Independent Review Panel (IRP) to provide recommendations on improving the University’s policies and procedures in response to disclosures and reports of sexual violence.
» Independent Review final report (pdf)
Academic unit reviews
The academic unit review process is an important component of Mount Allison’s commitment to accountability and quality assurance. The process is governed by University Policy 5900 — Academic Unit Reviews and overseen by the Senate Committee on University Planning. The results of reviews are reported to Senate and to the Board of Regents. The co-ordination of all unit reviews is the responsibility of the Office of the Provost and Vice-President, Academic and Research.
Completed academic unit reviews
Environmental responsibility
Environmental and energy initiatives
Mount Allison is continually looking for ways to reduce its environmental footprint.
A summary of energy-conscious initiatives and projects the University has undertaken, or is in the process of reviewing and implementing, is listed below.
COMPLETED PROJECTS
Residences
- Major residence renovations have included installing energy efficient features such as low flow, dual flush, LED lighting, insulation of exterior walls, roof replacements, new windows, etc. Renovations have taken place in the following residences:
- Campbell Hall (2004)
- Bennett House (2012)
- Bigelow House (2013)
- Thornton House (2016)
- Windsor Hall (2019)
- Eco-rep program established to improve energy efficiency and energy conservation awareness
- Dump & Donate program established for year-end move-out in residences to reduce waste
- LED lighting has been installed throughout the residence system
- C3 campaign is conducted each year to help raise awareness of and reduce energy consumption
- Residence furniture is sourced locally and many items are made with recycled material
Dining services
- An emphasis on local food purchases — 40 per cent comes from New Brunswick, PEI, and Nova Scotia
- Bulk purchases of food to reduce packaging waste
- Cooking oil is cleaned and reused resulting in a 50 per cent reduction in purchase of oil
- Bio-degradable containers/cutlery made from cornstarch are use in the two retail café operations — they disintegrate after 45 days, leaving no waste
- 100 per cent fair trade coffee, tea, and cocoa is available across campus
- Organic herb garden established on campus for dining hall use
- Established a station in Jennings that is never touched by meat — 25 per cent of students are vegetarian or vegan
- Food is freshly prepared and customized to student tastes to reduce food waste and is prepared on demand resulting in reduced leftovers
- Introduced tray-less dining and a scraping station, which has reduced post-consumer waste by 44 per cent
- All food waste at Jennings is composted
- A new dishwasher has been installed that uses 50 per cent less water
- The wood-fired pizza oven replaced an energy-heavy electric oven
- Ventilation and lighting upgrades have reduced energy use
- Added variable speed drives and cooking-level controls to the dining hall kitchen-hood exhaust system to limit fan power usage and fresh-air tempering when no, or low-load cooking, is taking place
Carpentry, trades, and grounds
- Reduced carbon footprint by switching from fossil-fueled trucks to electric utility vehicles
- Electric utility vehicles are equipped with solar panel charging systems
- Switched to environmentally-friendly chemicals for lubricants and graffiti removal
- Right-sized grounds equipment to eliminate unnecessary large trucks
Energy efficiency
- Transitioned to occupancy sensors from standard on/off light switching
- Transitioned to LED lighting technology from fluorescent, incandescent, and other lighting
- Transitioned to variable speed drive fans and motors in ventilation systems
- Implementing insulation repair/addition work throughout the steam tunnels and mechanical rooms to mitigate wasteful energy losses from energy transfer piping
- Boiler plant improvements:
- Converted fuels from bunker oil to natural gas
- Converted to computerized combustion controls to increase boiler efficiency
- Converted boiler feed and condensate return pumps to variable speed
- Installed a small boiler specifically for summer loads, to avoid running the larger boilers unnecessarily
- Optimization of lab/fume-hood exhaust system in Barclay Building
- Addition of heat recovery in buildings with exhaust systems running more than 14 hours per day (e.g. Windsor Hall, Campbell Hall)
Projects under evaluation or in the process of being implemented
Snow and ice management
- Improving annual snow and ice management equipment and processes with the implementation of a brining solution and equipment to reduce the amount of salt used on campus and align us with environmental best practices
Energy metering/dashboards
- Implementing individual building and campus-wide energy metering (steam, water, and power) to proactively identify energy consumption anomalies, allowing the campus to identify issues with systems/operations prior to excessive energy waste taking place
- Reviewing/implementing “load-shedding” and building start-stop programming in order to minimize electrical load peaks on campus, thus reducing the NB Power demand charges whenever possible (planned for after power meters are installed)
- Implementing “Energy Dashboards” across campus for social awareness as it relates to energy/water usage
Energy efficiency
- Replacing any remaining fluorescent/HID lighting with LED equivalents
- Implementing insulation repair/addition work throughout the steam tunnels and mechanical rooms to mitigate wasteful energy losses from energy transfer piping
- Boiler plant improvements:
- Employing more variable speed drives on boiler fans, etc. and adding additional computerized combustion controls and operating controls to further enhance efficiencies
- Reviewing the option of the addition of a renewable-energy boiler option using wood chips
Mechanical/electrical system improvements
- Replacing constant speed pumps with new variable-speed controlled pumps to reduce wasteful mechanical pumping power when not required
- Implementing/optimizing night-setback controls sequences in buildings to reduce building mechanical/electrical systems run-time during unoccupied times, holidays, snow-days, etc.
- Implementing/optimizing building heating water temperature controls to minimize pump run-time and minimize steam usage while still providing comfortable temperatures across campus (with the goal of reducing heating water temperatures as much as is practical)
- Reviewing the option of adding exhaust-air heat recovery to the Barclay lab exhaust fans to recover waste energy and preheat make-up air
Environmental audits
Did you know that Mount Allison conducts an Environmental Audit to assess the progress being made by the University towards achieving environmental sustainability?
The Environmental Audit has been conducted every two to three years since 1998. The audits are conducted by Mount Allison students as summer employment.
The audits use the performance indicators listed in Policy 2102: Environmental Policy and Policy 2101: Emission Reduction Policy to evaluate the University’s progress towards the carbon footprint reduction targets.
Environmental Audit reports
Facilities reports
Physical accessibility
Mount Allison's approach to facilities development and physical accessibility is guided by our Accessible Facilities Policy and regular communication with University community members, including student leaders.
The policy’s appendices indicate work that has been done or is planned to make University facilities more accessible. The University’s campus plan also includes a section about accessibility.
Find out more
- Accessible Facilities Policy (Policy 7610)
- Work that has been completed to improve accessibility on campus (Policy 7610 — Appendix A)
- Planned next steps to improve accessibility on campus (Policy 7610 — Appendix B)
- Campus Master Plan update (See section B for information on accessibility)
Water testing
Mount Allison has a comprehensive plan for water testing. Following Health Canada guidelines, Facilities Management has developed a plan to test the water in campus buildings for lead on a five to seven-year cycle.
Please address any questions to the Director of Facilities Management, Kris Kierstead, at krkierstead@mta.ca.
When will your building be tested
2022-23
Dunn Building
Edwards House
Facilities Management buildings
Fawcett Building
Flemington Building
2023-24
Hammond House
Harper Hall
Hart Hall
Hunton House
Jennings Hall
Marjorie Young Bell Music Conservatory
2024-25
Owens Art Gallery
President’s Cottage
Purdy Crawford Centre for the Arts
R.P. Bell Library
University Chapel
Wallace McCain Student Centre
Windsor Hall
York Street Daycare
2025-26
The Anchorage
Athletic Centre
Avard-Dixon Building
Barclay Building
Bennett Building
Bennett House
Bermuda House
Bigelow House
Carriage House
2026-27
Campbell Hall
Centennial Hall
Colville House
Convocation Hall
Crabtree Building
Thornton House
Testing protocol
The following protocol is used to carry out the testing:
- Locations are determined in consultation with building contacts from each building and represent locations where individuals could consume the water.
- The samples are analyzed by a certified laboratory.
- The testing protocol used was recommended by the New Brunswick Department of Health.
- A sample is taken from the cold water tap as soon as the tap is opened (first draw). These samples are sent to the lab for analysis.
- For all locations where lead levels are found to be above the guideline on first draw, a second sample is taken after the water has run for 30 seconds (second draw).
Drinking water guidelines
In March 2019, Health Canada lowered the drinking water guidelines for lead from 10 micrograms per litre (ug/L) to 5 micrograms per litre, as measured on the second draw after a 30 second flush.
All testing carried out after March 2019 uses 5 ug/L as the guideline. Testing carried out prior to March 2019 follows the 10 ug/L guideline.
WATER TESTING RESULTS
The most recent results for each building have been posted. Previous results are available from Facilities Management.
Summer 2021
The water in the following buildings was tested for lead on May 12, June 9, and Aug. 9, 2021:
- Campbell Hall
- Centennial Hall
- Colville House
- Convocation Hall
- Crabtree Building
- Thornton House
Of the 193 locations tested:
- 141 locations tested below lead levels of 5 ug/L on the first draw
- 52 locations were retested with a second draw
- 2 locations had a result above the 5 ug/L guideline on second draw
Those two locations are as follows:
- Two sinks in Campbell Hall.
- The faucets and valves were replaced.
- Upon retesting, these two locations tested below lead levels of 5 ug/L.
Full results of the testing by building (pdf)
June and July 2020
The water in the following buildings was tested for lead on June 11 and July 8, 2020
- The Anchorage
- Athletic Centre
- Avard-Dixon
- Barclay Building
- Bennett Building
- Bennett House
- Bermuda House
- Bigelow House
- Carriage House
Of the 126 locations tested:
- 106 locations tested below lead levels of 5 ug/L on the first draw
- 20 locations were retested with a second draw
- 0 locations had a result above the 5 ug/L guideline on second draw
Full results of the testing by building (pdf)
May and August 2019
The water in the following buildings was tested for lead on May 15, 2019 and Aug. 8, 2019:
- Owens Art Gallery
- President's Cottage
- Purdy Crawford Centre for the Arts
- R. P. Bell Library
- University Chapel
- Wallace McCain Student Centre
- York Street Children's Centre
- Windsor Hall
Of the 209 locations tested:
- 155 locations tested below lead levels of 5 ug/L on the first draw
- 53 locations were retested with a second draw
- 1 location had a result above the 5 ug/L guideline on second draw
The one location that had a result above the guideline on second draw — a sink in the Owens basement Conservation Laboratory — had its faucet replaced and the water was retested and met the guidelines.
Full results of the testing by building (pdf)
May and July 2018
The water in the following buildings was tested for lead on May 1, 2018 and July 11, 2018:
- Gairdner Building
- Hammond House
- Harper Hall
- Hart Hall
- Hunton House
- Jennings Hall
- Marjorie Young Bell Conservatory of Music
Of the 145 locations tested:
- 138 locations tested below lead levels of 10 ug/L on the first draw
- 7 locations were retested with a second draw
- 1 location had a result above the 10 ug/L guideline on second draw
The one location that had a result above the guideline on second draw — a sink in an office on the main floor of the Music Conservatory — had its faucet and valves replaced and the water was retested.
Full results of the testing by building (pdf)
May 2017
The water in the following buildings was tested for lead on May 17, 2017:
- Dunn Building
- Edwards House
- Facilities Management Building
- Fawcett Building
- Flemington Building
Of the 101 locations tested:
- 89 locations tested below lead levels of 10 ug/L on the first draw
- 12 locations were retested with a second draw
- 0 locations had a result above the 10 ug/L guideline on second draw
Asbestos management
Facilities Management maintains an inventory of all campus buildings that contain asbestos.
You can obtain copies of the reports by contacting Facilities Management at fixit@mta.ca.
Right to information
Request a record
Under New Brunswick's Right to Information and Protection of Privacy Act (RTIPPA), anyone may:
- request access to records related to the public business of the University
- access records containing personal information about themselves
- request corrections to records containing personal information about themselves
The vice-president, finance and administration is responsible for administering access to information and protection of privacy policies and procedures for the University.
The following University policies and provincial acts govern access to information and protection of personal privacy at Mount Allison:
- Personal Information Protection Policy — PIPEDA (University policy)
- Retention of Personal Information Policy (University policy)
- Right to Information and Protection of Privacy Act (provincial legislation)
- Personal Health Information Privacy and Access Act (provincial legislation)
Please direct all RTIPPA and related inquiries to the Office of the Vice-President, Finance and Administration at hbembridge@mta.ca or 506-364-2630.
Atlantic Common University Data Set
The Atlantic Provinces’ universities have worked co-operatively to develop and assemble the Atlantic Common University Data Set (ACUDS).
This is an online tool for students, parents, and the public that complements the extensive amount of information that universities make publicly available. This dataset allows users to access and compare data based on common definitions and displayed in a similar format.
A. General information
Mailing Address
62 York Street
Sackville New Brunswick
E4L 1E2
Canada
Street Address
65 York Street
Sackville New Brunswick
E4L 1E4
Canada
Admissions Information
65 York Street
Sackville New Brunswick
Canada
Phone: 506-364-2269
Fax: 506-364-2272
Email: admissions@mta.ca
Main Phone Number
(506) 364 2269
Internet Address
http://www.mta.ca
Section A2 — Qualifications offered/awarded
| Degree/Diploma/Certificate | Offered? | No. Awarded in calendar year 2023 |
|---|---|---|
| Undergraduate Certificate | Yes | 2 |
| Undergraduate Diploma | Yes | 0 |
| Bachelor's Degree | Yes | 460 |
| Graduate Certificate | No | 0 |
| Graduate Diploma | Yes | 0 |
| Master's Degree | Yes | 2 |
| Doctoral Degree | Yes | 0 |
Note: Includes all degrees/diplomas/certificates that are offered/awarded.
*Second entry professional degrees include: Law, Medicine, Dentistry, Optometry, Veterinary Medicine, Theology, Consecutive Education
Section A3 — Degrees Conferred by program, 2023
Number of degrees conferred in the calendar year 2023.
| program | bachelors and 1st professional degree | master's degree |
|---|---|---|
| Agriculture and Biological Science | 41 | 2 |
| Business and Commerce | 35 | - |
| Computer Science | 14 | - |
| Fine and Applied Arts | 43 | - |
| Humanities | 52 | - |
| Mathematics | 9 | - |
| Other Arts and Science | 115 | - |
| Physical Sciences | 66 | - |
| Social Sciences | 81 | - |
| Theology | 2 | - |
| Total: Domestic Degrees Conferred (1) | 460 | 2 |
| (1) Total: Domestic Degrees as reported in 2023 | 396 |
Section A4 — Male Enrolment by Program, 2023
Number of degree seeking students (headcount) enrolled for Fall 2023, including domestic and international students.
| Program | Bachelors and 1st professional degree | Master's degree | |
|---|---|---|---|
| Full-time enrolment | Part-Time Enrolment | full-time enrolment | |
| Agriculture and Biological Sciences | 66 | 6 | 5 |
| Business and Commerce | 172 | 4 | |
| Computer Science | 90 | 4 | |
| Fine and Applied Arts | 35 | 3 | |
| Humanities | 59 | 3 | |
| Mathematics | 19 | 1 | |
| Other Arts and Sciences | 177 | 8 | |
| Physical Sciences | 237 | 11 | 1 |
| Social Sciences | 93 | 10 | |
| Theology and Religious Studies | 1 | 1 | |
| Total: Domestic Enrolment | 949 | 38 | |
| Total: International Enrolment | 198 | 13 | |
(1) Total: Domestic Enrolment as reported in 2023
Note: The figures above do not necessarily include coop enrolment and work term enrolment.
Section A5 — Female Enrolment by Program, 2023
Number of degree seeking students (headcount) enrolled for Fall 2023, including domestic and international students. ddd
| Program | Bachelors and 1st professional degree | Master's degree | |
|---|---|---|---|
| Full-time enrolment | Part-Time Enrolment | full-time enrolment | |
| Agriculture and Biological Sciences | 216 | 7 | 6 |
| Business and Commerce | 109 | 1 | |
| Computer Science | 22 | 1 | |
| Fine and Applied Arts | 129 | 3 | |
| Humanities | 125 | 2 | |
| Mathematics | 18 | ||
| Other Arts and Sciences | 470 | 12 | |
| Physical Sciences | 178 | 6 | 3 |
| Social Sciences | 123 | 3 | |
| Theology and Religious Studies | 4 | 2 | |
| Total: Domestic Enrolment | 1239 | 30 | |
| Total: International Enrolment | 155 | 7 | |
(1) Total: Domestic Enrolment as reported in 2023
More detailed information by program: http://www.mta.ca/academics
Section A6 — Total Enrolment by Program, 2023
Number of degree seeking students (headcount) enrolled for Fall 2023, including domestic and international students.
| Program | Bachelors and 1st professional degree | Master's degree | |
|---|---|---|---|
| Full-time enrolment | Part-Time Enrolment | full-time enrolment | |
| Agriculture and Biological Sciences | 269 | 13 | 11 |
| Business and Commerce | 281 | 5 | |
| Computer Science | 103 | 5 | |
| Fine and Applied Arts | 164 | 6 | |
| Humanities | 184 | 5 | |
| Mathematics | 37 | 1 | |
| Other Arts and Sciences | 647 | 20 | |
| Physical Sciences | 415 | 17 | 4 |
| Social Sciences | 216 | 13 | |
| Theology and Religious Studies | 5 | 3 | |
| Total: Domestic Enrolment | 1966 | 68 | |
| Total: International Enrolment | 355 | 20 | |
(1) Total: Domestic Enrolment as reported in 2023: 2049
(2) Total: International Enrolment as reported in 2023: 375
More detailed information by program: http://www.mta.ca/academics
Section A7 — Full-Time Enrolment by Immigration Status, Fall 2023
Number of degree seeking international full-time students (headcount) enrolled for Fall 2023.
| Bachelors & 1st Professional degree | Master's degree | |||
|---|---|---|---|---|
| Canadian enrolment | Student Visa Enrolment | Canadian Enrolement | Student Visa Enrolment | |
| Total international students | 1899 | 178 | 14 | 5 |
B. Admission
Section B1 Registrants by Program, 2023
Full-time, first-year registrants in first entry programs by type and program
Bachelor of Arts: 265
Bachelor of Science: 237
Bachelor of Commerce: 77
Bachelor of Fine Arts: 9
Bachelor of Music: 19
Aviation: 91
Other: 17
Total registrants: 728
Section B2
Program Undergraduate Admission Requirements
For more information on Mount Allison's admissions process, including admission requirements, visit http://www.mta.ca/admissions/
For more detailed information and up-to-date policy on admission requirements, visit http://www.mta.ca/admissions/
Section B3
Secondary School Entering Averages of Full-Time, First Year Students by Range and Program, 2023
The following tables show the percentage of full-time, first year students by range and program. Averages are based on final grades for Grade 12 university destination courses.
| Degree | 95%+ | 90-94% | 85-89% | 80-84% | 75-79% | 70-74% | <70% | Overall Avg |
|---|---|---|---|---|---|---|---|---|
| Bachelor of Arts | 18.8% | 25.7% | 23.8% | 14.9% | 11.1% | 5.0% | - | 87.8% |
| Bachelor of Science | 24.3% | 34.9% | 15.8% | 17.3% | 5.6% | 2.1% | - | 89.9% |
| Bachelor of Commerce | 13.7% | 23.1% | 23.9% | 22.2% | 12.8% | 4.3% | - | 86.6% |
| Bachelor of Music | 26.3% | 26.3% | 10.5% | 26.3% | - | 5.3% | 5.3% | 87.9% |
| Bachelor of Fine Arts | 11.1% | 22.2% | 22.2% | 33.3% | 11.1% | - | - | 86.8% |
| Overall | 23.3% | 29.1% | 20.2% | 17.4% | 8.7% | 3.8% | 0.6% | 88.5% |
Sections B4/B5/B6
Application fee/Students accepted for a term other than fall/Deferred admission
Application fees
- Online Application Fee: $50
Admission in Winter, Spring, Summer terms
Are first-year students accepted for terms other than the fall? Yes
Note: Please see URL http://www.mta.ca/apply/
Deferred admission
Does your institution allow students to postpone enrolment after admission? Yes
If yes, maximum period of postponement: one year
Note: Please see URL http://www.mta.ca/apply/
If you have any questions or comments please contact Jonathan Parsons, Institutional Reporting and Data Analysis
C. Transfer admission from other post-secondary institutions
Sections C1 / C2 / C3
Transfer Admission From Other Postsecondary Institutions
Enrolment of Transfer Students
Do you enrol transfer students in first entry undergraduate programs? Yes
If yes above, may transfer students earn advanced standing credit by transferring credits earned from course work completed at other colleges/universities? Yes
For more information, please see: http://www.mta.ca/requirements
Transfer Students
Number of students who applied and enrolled as degree-seeking transfer students in Fall 2023:
Applicants: 187
Registrants: 91
Transfer students are those students who attended another postsecondary institution.
Transfer Credit Policies
http://www.mta.ca/requirements
Source: Individual Institutions
D. Library collections
Section D1
Library Collections
The number of holdings for the 2016-17 year for each of the following categories:
- Monograph Titles - Print Titles: 632,870
- Monograph Titles - Electronic Titles: 27,917
- Microform units: 83,398
- Government Documents: N/A (included in monograph titles)
- Manuscripts and Archives: N/A
- Printed Music Scores: 17,694
- Cartographic Materials: 22,928 (# of sheets)
- Graphic Materials: 1,523
- Audio Materials: 8,570
- Film & Video Materials: 5,410
- Serials - Print & Microform: 22,237
- Serials - Electronic: N/A (Included in aggregators)
- Serials - Electronic in aggregators: 218,021
For more information visit Mount Allison University Library.
E. Student life
Section E1
Residence of First-Time, Full-Time, First Year Undergraduate Students in Previous Year
The following is the percentage of first-time, full-time first-year undergraduate students enrolled in fall 2023 by their home address in the previous year:
Per cent from New Brunswick: 31.5%
Per cent from rest of Canada: 51.1%
Per cent from outside Canada: 17.4%
Section E2
Percentage of Full-Time, Undergraduate Students who live on campus, Fall 2023
First Year: 83%
Total Undergraduate: 34.3%
Section E3
Extracurricular Activities Offered
For a full description of all of the extracurricular clubs and activities, please visit http://www.mta.ca/studentlife/
Section E4
Housing
For a full description of all of our housing options, please visit http://www.mta.ca/residence
F. Student experience information
Section F1
Results from the NSSE (National Survey of Student Engagement) 2017 Survey
How would you evaluate your entire educational experience at this institution?
| Excellent | Good | Fair | Poor | |
|---|---|---|---|---|
| First year | 33.5% | 49.5% | 14.1% | 2.9% |
| Senior year | 47.2% | 43.5% | 8.3% | 1.0% |
If you could start over again, would you go to the same institution you are now attending?
| Definitely yes | Probably yes | Probably no | Definitely no | |
|---|---|---|---|---|
| First year | 44.8% | 39.2% | 10.7% | 5.3% |
| Senior year | 43.8% | 41.1% | 12.0% | 3.1% |
Section F2
Results from the CGPSS (Canadian Graduate Professional Student Survey)
Did not participate
Section F3
Results from the CUSC 2018 Survey
| Stongly agree/very satisfied | Agree/Satisfied | Disagree/Dissatisfied | Disagree stongly/very dissatisfied | |
|---|---|---|---|---|
| Generally, I am satisfied with the quality of teaching I have received | 25.1% | 68.4% | 4.2% | 2.1% |
| Satisfaction with concern sown by the university for students as individuals | 14.4% | 66.3% | 16.0% | 3.2% |
| I am satisfied with my decision to attend this university | 43.3% | 47.6% | 6.4% | 2.7% |
If you have any questions or comments please contact Jonathan Parsons, Institutional Reporting and Data Analysis
G. Annual student expenses
Section G1
Annual Expenses
First-year average undergraduate arts and science full-time tuition, ancillary fees, room and board, and other expenses, 2023-24.
| Domestic | International | |
|---|---|---|
| Tuition Fees: | $10,015 | $20,210 |
| Ancillary Fees: | see web | see web |
| Room and Board (on-campus): | see web | see web |
| Room Only (on-campus): | see web | see web |
| Board Only (on-campus meal plan): | see web | see web |
| Books and Supplies: | see web | see web |
| Transportation: | see web | see web |
| Other Expenses: | see web | see web |
| TOTAL: | $10,015 | $20,210 |
Note: These expenses are for the full 2023-24 academic year, which refers to the period of time generally extending from September to June, usually equated to two semesters or three trimesters. Ancillary fees include only charges that all full-time students must pay that are not included in tuition (e.g., registration, health, or activity fees) and do not include optional fees (e.g., parking, laboratory use).
For more detailed information on fees:
https://mta.ca/current-students/student-finances/tuition-fees-and-payments
Additional Note: Please see URL listed above for further details on costs.
If you have any questions or comments please contact Jonathan Parsons, Institutional Reporting and Data Analysis
H. Instructional faculty and class size
Section H1
Instructional Faculty and Class Size
Instructional faculty members (excluding clinicians) in each category for Fall 2022:
| Full-Time | Part-Time (FTE) | |
|---|---|---|
| Total number of instructional faculty: | 138 | 34 |
| Total number who are women: | 65 | 18 |
| Total number with doctorate, first professional, or other highest level degrees: | 133 | 19 |
Section H2
Undergraduate Class Size by Year Level, 2022
| Class sections | 1st year | 2nd year | 3rd year | 4th year | ||||
|---|---|---|---|---|---|---|---|---|
| (#) | (%) | (#) | (%) | (#) | (%) | (#) | (%) | |
| < 30 students | 60 | 37.3% | 108 | 59.0% | 216 | 80.9% | 247 | 98% |
| 30-60 students | 50 | 31.1% | 54 | 29.5% | 51 | 19.1% | 5 | 2.0% |
| 61-100 students | 29 | 18.0% | 17 | 9.3% | 0 | 0% | 0 | 0% |
| 101-250 students | 22 | 13.7% | 4 | 2.2% | 0 | 0% | 0 | 0% |
| 251+ students | 0 | 0% | 0 | 0% | 0 | 0% | 0 | 0% |
| TOTAL | 161 | % | 183 | % | 267 | % | 252 | % |
| Class Sub Sections (i.e. lab, tutorial) | ||||||||
| < 30 students | 62 | 65.3% | 47 | 73.4% | 40 | 97.6% | 8 | 100% |
| 30-60 students | 33 | 34.7% | 17 | 26.6% | 1 | 2.4% | 0 | 0% |
| TOTAL | 95 | % | 64 | % | 41 | % | 8 | |
Note: There are a number of one-on-one instruction classes, including independent study and practicums at our institution. The following are the number of these classes by year level. Data on subsectioning may not be complete in all cases, as many departments schedule these subsections without notifying the central Scheduling Office:
1st year: 5
2nd year: 3
3rd year: 26
4th year: 196
Total: 230
If you have any questions or comments please contact Jonathan Parsons, Institutional Reporting and Data Analysis
I. University revenue and expenses
Section I1. University Revenue
University revenue figures for the fiscal year ending April 30, 2017 as reported to CAUBO (Canadian Association of University Business Officers).
| Sponsored research | |||||||||||||||||||
|---|---|---|---|---|---|---|---|---|---|---|---|---|---|---|---|---|---|---|---|
| Funds | General operating | Special purpose and trust |
Entities Consolidated | Entities not Consolidated | Sub-total | Ancillary | Capital | Endowment | Total funds | ||||||||||
| Federal Government departments and agencies grants and contracts | |||||||||||||||||||
| 1. Social Sciences and Humanities Research Council | 0 | 0 | 264 | 0 | 264 | 0 | 0 | 0 | 264 | ||||||||||
| 2. Health Canada | 0 | 0 | 0 | 0 | 0 | 0 | 0 | 0 | 0 | ||||||||||
| 3. Natural Sciences and Engineering Research Council | 0 | 0 | 1,149 | 0 | 1,149 | 0 | 0 | 0 | 1,149 | ||||||||||
| 4. Canadian Institutes of Health Research (CIHR) | 0 | 0 | 0 | 0 | 0 | 0 | 0 | 0 | 0 | ||||||||||
| 5. Canada Foundation for Innovation (CFI) | 0 | 0 | 291 | 0 | 291 | 0 | 0 | 0 | 291 | ||||||||||
| 6. Canada Research Chairs | 0 | 0 | 517 | 0 | 517 | 0 | 0 | 0 | 517 | ||||||||||
| 7. Other federal | 0 | 4992 | 956 | 0 | 956 | 0 | 0 | 0 | 5948 | ||||||||||
| Total Federal Government deapartments and agencies grants and contracts (Lines 1-7) | 0 | 4,992 | 3,177 | 0 | 3,177 | 0 | 3,177 | 0 | 3,019 | ||||||||||
| Other Government departments and agencies grants and contracts | |||||||||||||||||||
| 8. Provincial | 21,781 | 425 | 524 | 0 | 524 | 0 | 0 | 0 | 22,730 | ||||||||||
| 9. Municipal | 0 | 1 | 0 | 0 | 0 | 0 | 0 | 0 | 1 | ||||||||||
| 10. Other provinces | 0 | 0 | 0 | 0 | 0 | 0 | 0 | 0 | 0 | ||||||||||
| 11. Foreign | 0 | 0 | 0 | 0 | 0 | 0 | 0 | 0 | 0 | ||||||||||
| Total Other Government departments and agencies grants and contracts (Lines 8 11) | 21781 | 426 | 524 | 0 | 524 | 0 | 0 | 0 | 22,731 | ||||||||||
| Total Government departments and agencies grants and contracts (Line 1 -11) | 21,781 | 5,418 | 3,701 | 0 | 3,701 | 0 | 0 | 0 | 30,899 | ||||||||||
| Tuition and other fees | |||||||||||||||||||
| 12. Credit course tuition | 18,785 | 0 | 0 | 0 | 0 | 0 | 0 | 0 | 18,785 | ||||||||||
| 13. Non-credit tuition | 268 | 0 | 0 | 0 | 0 | 0 | 0 | 0 | 268 | ||||||||||
| 14. Other fees | 1,138 | 0 | 0 | 0 | 0 | 0 | 0 | 0 | 1,138 | ||||||||||
| Total Tuition and other fees (lines 12 -14) | 20,191 | 0 | 0 | 0 | 0 | 0 | 0 | 0 | 20,191 | ||||||||||
| Donations, including bequests | |||||||||||||||||||
| 15. Individuals | 135 | 876 | 0 | 0 | 0 | 0 | 0 | 4,843 | 5,854 | ||||||||||
| 16. Business enterprises | 1 | 164 | 0 | 0 | 0 | 0 | 0 | 543 | 708 | ||||||||||
| 17. Not-for-profit organizations | 48 | 686 | 0 | 0 | 0 | 0 | 0 | 1,946 | 2,680 | ||||||||||
| Total Donations, including bequests (lines 15-17) | 184 | 1,726 | 0 | 0 | 0 | 0 | 0 | 7,332 | 9,242 | ||||||||||
| Non-government grants and contracts | |||||||||||||||||||
| 18. Individuals | 0 | 0 | 0 | 0 | 0 | 0 | 0 | 0 | 0 | ||||||||||
| 19. Business enterprises | 0 | 0 | 0 | 0 | 0 | 0 | 0 | 0 | 0 | ||||||||||
| 20. Not-for-profit organizations | 0 | 0 | 1,121 | 0 | 1,121 | 0 | 0 | 0 | 1,121 | ||||||||||
| Total Non-government grants and contracts (lines 18 - 20) | 0 | 0 | 1,121 | 0 | 1,121 | 0 | 0 | 0 | 1,121 | ||||||||||
| Investment | |||||||||||||||||||
| 21. Endowment | 1,920 | 5,938 | 0 | 0 | 0 | 0 | 0 | (1,021) | 6,836 | ||||||||||
| 22. Other investment | 354 | 0 | 0 | 0 | 0 | 0 | 0 | 0 | 354 | ||||||||||
| Total Investment (lines 21 - 22) | 2,274 | 5,938 | 0 | 0 | 0 | 0 | 0 | (1,021) | 7,190 | ||||||||||
| Other income | |||||||||||||||||||
| 23. Sale of services and products | 896 | 26 | 0 | 0 | 0 | 12,494 | 0 | 0 | 13,416 | ||||||||||
| 24. Miscellaneous | 165 | 66 | 0 | 0 | 0 | 0 | 0 | 0 | 232 | ||||||||||
| Total Other income (lines 23 - 24) | 1061 | 92 | 0 | 0 | 0 | 12,494 | 0 | 0 | 13,648 | ||||||||||
| Total - Non-Government Income (lines 12 - 24) | 23,710 | 7,756 | 1,121 | 0 | 1,121 | 12,494 | 0 | 6,311 | 51,392 | ||||||||||
| 25. Total (lines 1 - 24) | 45,491 | 13,174 | 4,821 | 0 | 4,821 | 12,494 | 0 | 6,311 | 82,291 | ||||||||||
Section I2. University Expenses
University expense figures for the fiscal year ending April 30, 2017 as reported to CAUBO (Canadian Association of University Business Officers).
| General Expendable Funds | Restricted Expendable Funds | ||||||||||||||||||
|---|---|---|---|---|---|---|---|---|---|---|---|---|---|---|---|---|---|---|---|
| Sponsored Research | |||||||||||||||||||
| General Operating | Special purpose and Trust | Entities Consolidated | Entities Not Consolidated | Subtotal | Ancillary | Capital | Endowment | Total | |||||||||||
| Salaries and Wages | |||||||||||||||||||
| 1. Academic Ranks | 17,484 | 957 | 34 | 0 | 34 | 0 | 0 | 0 | 18,474 | ||||||||||
| 2. Other Instruction & Research | 1,291 | 32 | 1,281 | 0 | 1,281 | 0 | 0 | 0 | 2,604 | ||||||||||
| 3. Other Salaries & Wages | 10,758 | 2,146 | 654 | 0 | 654 | 2,346 | 0 | 0 | 15,904 | ||||||||||
| 4. Employee Benefits | 4,160 | 382 | 83 | 0 | 83 | 425 | 0 | 0 | 5,050 | ||||||||||
| Total Salaries and Benefits 1-4 | 33,693 | 3,517 | 2,052 | 0 | 2,052 | 2,771 | 0 | 0 | 42,032 | ||||||||||
| 5. Travel | 982 | 340 | 486 | 0 | 486 | 23 | 0 | 0 | 1,830 | ||||||||||
| 6. Library Acquisitions | 503 | 435 | 0 | 0 | 0 | 0 | 0 | 0 | 938 | ||||||||||
| 7. Printing and Duplicating | 203 | 36 | 0 | 0 | 0 | 10 | 0 | 0 | 250 | ||||||||||
| 8. Materials and Supplies | 944 | 247 | 701 | 0 | 701 | 195 | 0 | 0 | 2088 | ||||||||||
| 9.Communications | 309 | 1 | 4 | 0 | 4 | 70 | 0 | 0 | 384 | ||||||||||
| 10. Other Operational Expenditures | 1,313 | 276 | 13 | 0 | 13 | 523 | 0 | 0 | 2,125 | ||||||||||
| 11. Utilities | 2,023 | 0 | 0 | 0 | 0 | 1,213 | 0 | 0 | 3,236 | ||||||||||
| 12. Renovations and Alterations | 363 | 344 | 1 | 0 | 1 | 182 | 0 | 0 | 890 | ||||||||||
| 13. Scholarships, Bursaries, etc. | 426 | 3,145 | 7 | 0 | 7 | 0 | 0 | 0 | 3,577 | ||||||||||
| 14. Externally Contracted Services | 570 | 357 | 88 | 0 | 88 | 3,221 | 0 | 0 | 4,235 | ||||||||||
| 15. Professional Fees | 292 | 860 | 139 | 0 | 139 | 4 | 0 | 0 | 1,295 | ||||||||||
| 16. Cost of Goods Sold | 13 | 0 | 0 | 0 | 0 | 1,124 | 0 | 0 | 1,137 | ||||||||||
| 17. Interest | 0 | 0 | 0 | 0 | 0 | 3 | 0 | 0 | 3 | ||||||||||
| 18. Furniture and Equipment Purchases | 279 | 557 | 442 | 0 | 442 | 539 | 0 | 0 | 1,817 | ||||||||||
| 19. Equipment Rental and Maintenance | 1,097 | 32 | 20 | 0 | 20 | 350 | 0 | 0 | 1,499 | ||||||||||
| 20. Internal sales and cost recoveries | (889) | 49 | 836 | 0 | 836 | 4 | 0 | 0 | 0 | ||||||||||
| 21. Total (lines 5-20) | 8,428 | 6,679 | 2,737 | 0 | 2,737 | 7,461 | 0 | 0 | 25,304 | ||||||||||
| 22. Buildings, land and land improvements | 1,579 | 7,472 | 0 | 0 | 0 | 2,215 | 5,846 | 0 | 17,111 | ||||||||||
| 23. Lump sum payments | 0 | 0 | 0 | 0 | 0 | 0 | 0 | 0 | 0 | ||||||||||
| Total (lines 1-23) | 43,700 | 17,667 | 4,788 | 0 | 4,788 | 12,447 | 5,846 | 0 | 84,448 | ||||||||||
If you have any questions or comments please contact Jonathan Parsons, Institutional Reporting and Data Analysis
J. Research
Section J
Research Awards, by Granting Council
Social Sciences and Humanities Research Council of Canada (SSHRC) 2017-2018
All Payments by Program Activity 2017-18. Excludes indirect costs.
Number of awards: 4
Funding ($): $100,148
Natural Science and Engineering Research Council of Canada (NSERC) 2017-18
Table 13: Grants and Scholarships by University/College.
Number of awards: 30
Funding ($): $885,561
Canadian Institutes of Health Research (CIHR) 2017-18
CIHR Funding Database. Funding Type: All
Number of awards: 0
Funding ($): $0
Sources: Social Sciences and Humanities Research Council of Canada (SSHRC), Natural Science and Engineering Research Council of Canada (NSERC), and Canadian Institutes of Health Research (CIHR)
K. Other useful information
Section K2
Key Performance Indicators
Degree Completion Rate for Undergraduate Cohort, Fall 2014, New, Year 1 Students
Program and graduation rate (%)
- Business and Commerce: 74.3%
- Fine and Applied Arts: 79.1%
- Other Arts and Science: 68.6%
Total new full-time year one undergraduate students enrolled in fall 2014: 637
Total students reported above who graduated by 2020: 404
Section K3
Retention Rates
The percentage of first-time, full-time first year students in a given fall term who returned to the institution in the next fall term.
Year 1 to Year 2 Retention Rate 2021-2022: 85.4%
If you have any questions or comments about the ACUDS, please contact Jonathan Parsons, Institutional Reporting and Data Analysis, jparsons@mta.ca.